📊 R 데이터 분석
2024 변호사 시험 기수별 응시자 · 합격자 정보
해랑(Sea-wave)
2024. 10. 10. 23:13
반응형
library(ggplot2)
# 데이터 입력
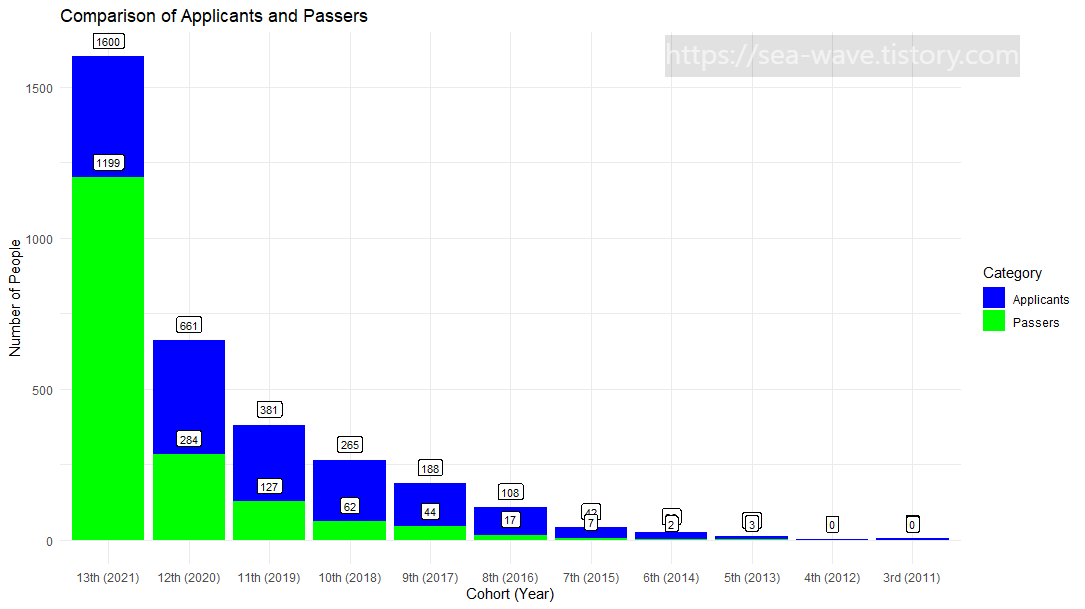
data <- data.frame(
cohort = factor(c("13th (2021)", "12th (2020)", "11th (2019)", "10th (2018)",
"9th (2017)", "8th (2016)", "7th (2015)", "6th (2014)",
"5th (2013)", "4th (2012)", "3rd (2011)"),
levels = c("13th (2021)", "12th (2020)", "11th (2019)",
"10th (2018)", "9th (2017)", "8th (2016)",
"7th (2015)", "6th (2014)", "5th (2013)",
"4th (2012)", "3rd (2011)")),
applicants = c(1600, 661, 381, 265, 188, 108, 42, 26, 13, 1, 5),
passers = c(1199, 284, 127, 62, 44, 17, 7, 2, 3, 0, 0)
)
# 합격자 비율 계산
data$pass_rate <- data$passers / data$applicants * 100
### 글자수 추가
ggplot(data, aes(x = cohort)) +
geom_bar(aes(y = applicants, fill = "Applicants"), stat = "identity", position = "dodge") +
geom_bar(aes(y = passers, fill = "Passers"), stat = "identity", position = "dodge") +
geom_label(aes(y = applicants, label = applicants),
position = position_dodge(width = 0.9), vjust = -0.5, size = 3,
fill = "white", color = "black") + # 응시자 인원수에 배경색 추가
geom_label(aes(y = passers, label = passers),
position = position_dodge(width = 0.9), vjust = -0.5, size = 3,
fill = "white", color = "black") + # 합격자 인원수에 배경색 추가
labs(title = "Comparison of Applicants and Passers",
x = "Cohort (Year)",
y = "Number of People") +
scale_fill_manual(name = "Category", values = c("Applicants" = "blue", "Passers" = "green")) +
theme_minimal()반응형