반응형


library(tidyverse)
library(lubridate)
library(scales)  # rescale() 및 squish() 사용
library(ggthemes)    # 다양한 테마 사용 가능
library(viridis)     # 색상 조정

# 전문가용 색상 팔레트 (과목 분석용)
study_colors <- c("#1f78b4", "#33a02c", "#e31a1c", "#ff7f00", "#6a3d9a", "#b15928")

# 바탕화면의 CSV 파일 불러오기 및 전처리
file_path <- file.path(Sys.getenv("USERPROFILE"), "Desktop", "BeFocused.csv")
study_data <- read_csv(file_path) %>%
  rename(
    Start_date = `Start date`,
    Assigned_task = `Assigned task`
  ) %>%
  mutate(
    Start_time = mdy_hms(Start_date),
    Weekday    = wday(Start_time, label = TRUE, abbr = FALSE),
    Date       = as_date(Start_time),
    Hour       = hour(Start_time),
    Study_time = 25   # 모든 세션은 25분
  )
# 1. 과목별 총 공부량 분석 (가로 막대그래프)
subject_summary <- study_data %>%
  group_by(Assigned_task) %>%
  summarise(Total_study_time = sum(Study_time, na.rm = TRUE))

ggplot(subject_summary, aes(x = reorder(Assigned_task, Total_study_time), y = Total_study_time, fill = Assigned_task)) +
  geom_bar(stat = "identity") +
  scale_fill_manual(values = study_colors) +
  coord_flip() +
  theme_minimal(base_size = 14) +
  labs(title = "과목별 총 공부 시간",
       x = "과목",
       y = "총 공부 시간 (분)") +
  theme(legend.position = "none")


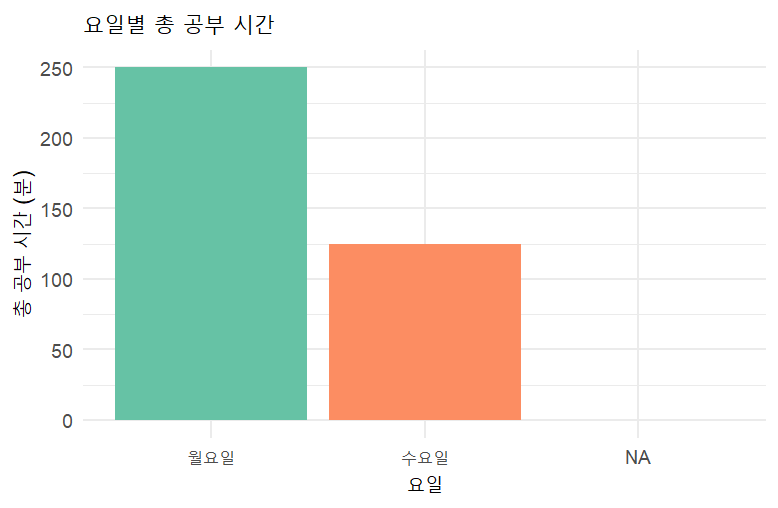
# 2. 요일별 총 공부량 분석 (세로 막대그래프)
weekday_summary <- study_data %>%
  group_by(Weekday) %>%
  summarise(Total_study_time = sum(Study_time, na.rm = TRUE))

ggplot(weekday_summary, aes(x = Weekday, y = Total_study_time, fill = Weekday)) +
  geom_bar(stat = "identity") +
  scale_fill_brewer(palette = "Set2") +
  theme_minimal(base_size = 14) +
  labs(title = "요일별 총 공부 시간",
       x = "요일",
       y = "총 공부 시간 (분)") +
  theme(legend.position = "none")


# 3. 날짜별 총 공부량 분석 (영역 차트)
date_summary <- study_data %>%
  group_by(Date) %>%
  summarise(Total_study_time = sum(Study_time, na.rm = TRUE))

ggplot(date_summary, aes(x = Date, y = Total_study_time)) +
  geom_area(fill = "steelblue", alpha = 0.6) +
  geom_line(color = "steelblue", size = 1) +
  geom_point(color = "darkblue", size = 2) +
  theme_minimal(base_size = 14) +
  labs(title = "날짜별 총 공부 시간",
       x = "날짜",
       y = "총 공부 시간 (분)") +
  theme(axis.text.x = element_text(angle = 45, hjust = 1))
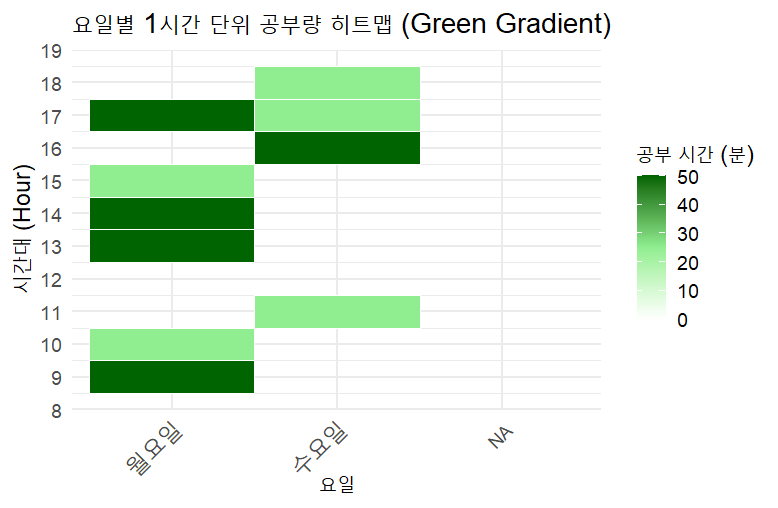
# 요일별 1시간 단위 공부량 집계
hourly_weekday_summary <- study_data %>%
  group_by(Weekday, Hour) %>%
  summarise(Total_study_time = sum(Study_time, na.rm = TRUE), .groups = "drop")

# 요일별 1시간 단위 공부량 히트맵 생성:
# 0분 -> white, 25분 -> lightgreen, 50분 -> darkgreen
ggplot(hourly_weekday_summary, aes(x = Weekday, y = Hour, fill = Total_study_time)) +
  geom_tile(color = "white") +
  scale_fill_gradientn(
    colors = c("white", "lightgreen", "darkgreen"),
    values = rescale(c(0, 25, 50)),
    limits = c(0, 50),    # 0부터 50까지의 범위로 고정
    oob = squish         # 범위를 벗어난 값은 50에 맞춰 압축
  ) +
  theme_minimal(base_size = 14) +
  labs(
    title = "요일별 1시간 단위 공부량 히트맵 (Green Gradient)",
    x     = "요일",
    y     = "시간대 (Hour)",
    fill  = "공부 시간 (분)"
  ) +
  scale_y_continuous(breaks = seq(0, 23, by = 1)) +
  theme(axis.text.x = element_text(angle = 45, hjust = 1))
반응형
'🍀 감정 & 자동적 사고' 카테고리의 다른 글
| 벤자민 프랭클린과 유예된 삶 (6) | 2025.06.19 |
|---|---|
| Proactive와 Reactive의 차이 (0) | 2025.04.27 |